Market Outlook
November 22, 2017
Market Cues
Domestic Indices
Chg (%)
(Pts)
(Close)
Indian markets are likely to open flat tracking global indices and SGX Nifty.
BSE Sensex
0.4
118
33,478
Nifty
0.3
28
10,327
U.S. stocks rose to record highs on Tuesday as a rally in tech lifted the broader
market. Investors also cheered strong quarterly results from top companies in
Mid Cap
0.1
16
16,794
Corporate America.
Small Cap
0.4
66
17,813
Bankex
(0.0)
(14)
29,207
The European markets ended Tuesday's session in the green, adding to the modest
gains of the previous session. Traders remain in a cautious mood due to the political
Global Indices
Chg (%)
(Pts)
(Close)
uncertainty in Germany. However, the markets received a boost from some positive
corporate news. The early gains on Wall Street also provided support in the
Dow Jones
0.7
161
23,430
afternoon
Nasdaq
1.1
72
6,862
FTSE
0.3
22
7,411
Indian markets closed higher of the fourth consecutive session on Tuesday, although
Nikkei
0.7
155
22,416
overall gains remained muted ahead of derivatives expiry due next week.
Hang Seng
1.9
558
29,818
News Analysis
Shanghai Com
0.5
18
3,410
Dr Reddy's (DRL) gets EIR for Vizag Plant
Detailed analysis on Pg2
Advances / Declines
BSE
NSE
Advances
1,460
1,103
Investor’s Ready Reckoner
Declines
1,258
650
Key Domestic & Global Indicators
Unchanged
160
74
Stock Watch: Latest investment recommendations on 150+ stocks
Refer Pg5 onwards
Volumes (` Cr)
Top Picks
BSE
3,572
CMP
Target
Upside
Company
Sector
Rating
NSE
33,643
(`)
(`)
(%)
Blue Star
Capital Goods
Buy
697
867
24.4
Dewan Housing Finance
Financials
Accumulate
621
712
14.6
Net Inflows (` Cr)
Net
Mtd
Ytd
Asian Granito
Other
Buy
494
570
15.4
FII
289
14,403
52,855
Navkar Corporation
Other
Buy
190
265
39.2
MFs
2,326
3,825
99,236
KEI Industries
Capital Goods Accumulate
333
380
14.2
More Top Picks on Pg4
Top Gainers
Price (`)
Chg (%)
Key Upcoming Events
Rcom
13
11.6
Previous
Consensus
Date
Region
Event Description
Reading
Expectations
Mcleodruss
192
11.5
Nov22
US
Initial Jobless claims
249.00
240.00
Trent
337
7.4
Nov22
Germany GDP nsa (YoY)
2.30
2.30
Sadbhav
340
7.3
Nov23
Euro Zone Euro-Zone Consumer Confidence
(1.00)
(0.80)
Gppl
140
5.9
Nov23
Germany PMI Services
54.70
55.00
Nov23
US
New home sales
667.00
615.00
More Events on Pg7
Top Losers
Price (`)
Chg (%)
Jetairways
663
(8.0)
Renuka
17
(6.4)
Gati
133
(5.8)
L&Tfh
179
(4.8)
Adanient
153
(4.3)
As on November, 21 2017
Market Outlook
November 22, 2017
News Analysis
Dr Reddy's (DRL) gets EIR for Vizag Plant
Dr Reddy's Laboratories (DRL) today received an establishment inspection report
(EIR) from the US health regulator for its formulation manufacturing facility at
Duvvada in Visakhapatnam. However, it said that the US Food and Drug
Administration has not closed the inspection & the manufacturing site's status
remains unchanged. In the cover letter the USFDA, has explained that inspection
has not closed & the site's status remains unchanged.
The USFDA has released the EIR in order to be transparent about its regulatory
process. DRL plans to request a re-inspection in 2018 after further discussion on
scheduling with the US regulator for its Duvvada facility. As far financials are
concerned, the event won’t change the status of the company as EIR is just an
observation note and doesn’t equates to the company getting a clean chit from
USFDA.
EIR is the name given by the US Food and Drug Administration (US FDA) for an
entire narration of what the FDA investigator / inspector did during the time spent
at the establishment (facility), from the stage of introductions till the handover of
the inspectional observations (termed as Form FDA 483). The EIR is expected to be
a compilation of factual information. Thus we maintain reduce recommendation
with a Price Target of `2,040.
Eris Lifesciences - Book profit
Ahmadabad based Pharma Company Eris Lifesciences had came with an IPO in
June 2017. The issue was oversubscribed by 3.3x. Eris Life is a specialty pharma
company with 100% focus on the domestic market. It owns and operates a
manufacturing facility in Guwahati, Assam. Company also outsources
manufacturing of its certain products. The company has reported impressive
record of growth and profitability. Considering the track record, we had put a
subscribe rating on the issue. The stock at the CMP of `648 yields about 7%
returns from the IPO price and we believe that investors should book profit in the
scrip.
Economic and Political News
Railways will now use big data and AI to make your train travel safer
ICRA sees GVA growth inching up to 6.3% in Q2
India's food processing sector may attract $33 bn by 2024: Assocham survey
Corporate News
Future Group aims to open 10,000 Easyday stores by 2022
Muthoot Capital raises `165 cr via QIP, dilutes 12.5% stake
Dabur passes on benefits of GST rate cut, reduces some product prices by
9%
Market Outlook
November 22, 2017
Top Picks HHHHH
Market Cap
CMP
Target
Upside
Company
Rationale
(` Cr)
(`)
(`)
(%)
Strong growth in domestic business due to its leade`hip
in acute therapeutic segment. Alkem expects to launch
Alkem Laboratories
23,368
1,954
2,125
8.7
more products in USA, which bodes for its international
business.
We expect the company would report strong profitability
Asian Granito
1,486
494
570
15.4
owing to better product mix, higher B2C sales and
amalgamation synergy.
Favorable outlook for the AC industry to augur well for
Cooling products business which is out pacing the
Blue Star
6,681
697
867
24.4
market growth. EMPPAC division's profitability to
improve once operating environment turns around.
With a focus on the low and medium income (LMI)
consumer segment, the company has increased its
Dewan Housing Finance
19,486
621
712
14.6
presence in tier-II & III cities where the growth
opportunity is immense.
Loan growth is likely to pick up after a sluggish FY17.
Lower credit cost will help in strong bottom-line growth.
Karur Vysya Bank
7,348
122
180
48.0
Increasing share of CASA will help in NIM
improvement.
High order book execution in EPC segment, rising B2C
KEI Industries
2,608
333
380
14.2
sales and higher exports to boost the revenues and
profitability
Expected to benefit from the lower capex requirement
Music Broadcast
2,116
371
434
17.0
and 15 year long radio broadcast licensing.
Massive capacity expansion along with rail advantage
Navkar Corporation
2,866
190
265
39.2
at ICD as well CFS augur well for the company
Strong brands and distribution network would boost
Siyaram Silk Mills
2,741
585
650
11.1
growth going ahead. Stock currently trades at an
inexpensive valuation.
Market leadership in Hindi news genre and no.
2
viewership ranking in English news genre, exit from the
TV Today Network
2,247
377
435
15.5
radio business, and anticipated growth in ad spends by
corporate to benefit the stock.
After GST, the company is expected to see higher
volumes along with improving product mix. The Gujarat
Maruti Suzuki
2,54,457
8,424
8,890
5.5
plant will also enable higher operating leverage which
will be margin accretive.
We expect loan book to grow at 24.3% over next two
GIC Housing
2,323
431
655
51.8
year; change in borrowing mix will help in NIM
improvement..
Source: Company, Angel Research
Market Outlook
November 22, 2017
Key Upcoming Events
Global economic events release calendar
Bloomberg Data
Date
Time Country
Event Description
Unit
Period
Last Reported
Estimated
Nov 22, 2017
7:00 PMUS
Initial Jobless claims
Thousands
Nov 18
249.00
240.00
12:30 PMGermany
GDP nsa (YoY)
% Change
3Q F
2.30
2.30
Nov 23, 2017
8:30 PMEuro Zone
Euro-Zone Consumer Confidence
Value
Nov A
(1.00)
(0.80)
2:00 PMGermany
PMI Services
Value
Nov P
54.70
55.00
8:30 PMUS
New home sales
Thousands
Oct
667.00
615.00
2:00 PMGermany
PMI Manufacturing
Value
Nov P
60.60
60.40
Nov 27, 2017
3:00 PMUK
GDP (YoY)
% Change
3Q P
1.50
1.50
Nov 28, 2017
8:30 PMUS
Consumer Confidence
S.A./ 1985=100
Nov
125.90
123.75
Nov 29, 2017
7:00 PMUS
GDP Qoq (Annualised)
% Change
3Q S
3.00
3.30
Nov 30, 2017
2:25 PMGermany
Unemployment change (000's)
Thousands
Nov
(11.00)
6:30 AMChina
PMI Manufacturing
Value
Nov
51.60
Dec 01, 2017
3:00 PMUK
PMI Manufacturing
Value
Nov
56.30
Dec 05, 2017
3:30 PMEuro Zone
Euro-Zone GDP s.a. (QoQ)
% Change
3Q F
0.60
Dec 06, 2017
2:30 PMIndia
RBI Reverse Repo rate
%
Dec 6
5.75
2:30 PMIndia
RBI Repo rate
%
Dec 6
6.00
2:30 PMIndia
RBI Cash Reserve ratio
%
Dec 6
4.00
Dec 08, 2017
India
Imports YoY%
% Change
Nov
7.60
3:00 PMUK
Industrial Production (YoY)
% Change
Oct
2.50
India
Exports YoY%
% Change
Nov
(1.10)
China
Exports YoY%
% Change
Nov
6.90
7:00 PMUS
Change in Nonfarm payrolls
Thousands
Nov
261.00
7:00 PMUS
Unnemployment rate
%
Nov
4.10
Dec 09, 2017
7:00 AMChina
Consumer Price Index (YoY)
% Change
Nov
1.90
Dec 12, 2017
5:30 PMIndia
Industrial Production YoY
% Change
Oct
3.80
Source: Bloomberg, Angel Research
Market Outlook
November 22, 2017
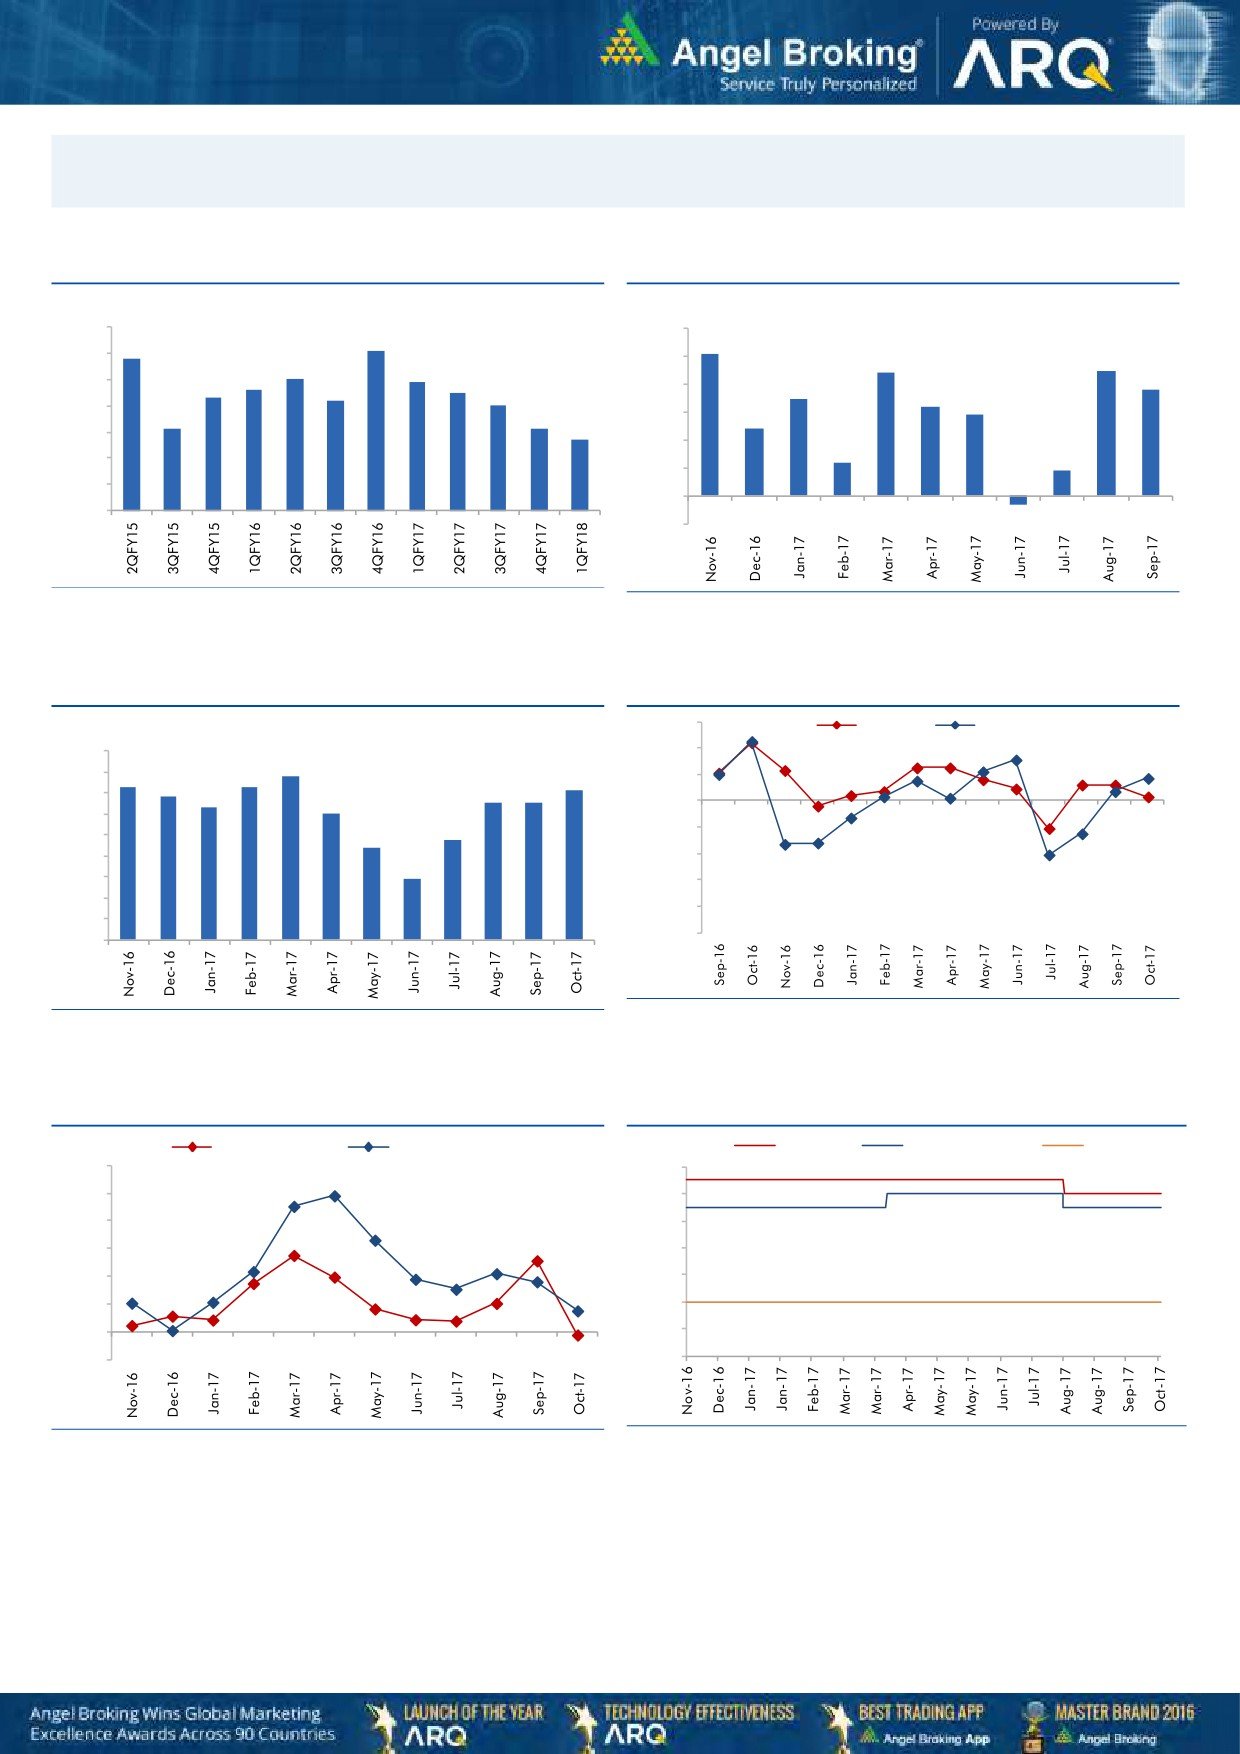
Macro watch
Exhibit 1: Quarterly GDP trends
Exhibit 2: IIP trends
(%)
(%)
10.0
6.0
9.1
5.1
8.8
9.0
5.0
4.4
4.5
8.0
7.9
7.6
7.5
3.8
8.0
7.3
7.2
4.0
3.5
7.0
3.2
2.9
7.0
6.1
6.1
3.0
2.4
5.7
6.0
2.0
1.2
5.0
0.9
1.0
4.0
-
3.0
(1.0)
(0.3)
Source: CSO, Angel Research
Source: MOSPI, Angel Research
Exhibit 3: Monthly CPI inflation trends
Exhibit 4: Manufacturing and services PMI
56.0
Mfg. PMI
Services PMI
(%)
4.5
54.0
3.9
4.0
3.6
3.7
3.6
52.0
3.4
3.2
3.3
3.3
3.5
3.0
50.0
3.0
2.4
48.0
2.5
2.2
2.0
46.0
1.5
1.5
44.0
1.0
42.0
0.5
40.0
-
Source: Market, Angel Research; Note: Level above 50 indicates expansion
Source: MOSPI, Angel Research
Exhibit 5: Exports and imports growth trends
Exhibit 6: Key policy rates
(%)
Exports yoy growth
Imports yoy growth
(%)
Repo rate
Reverse Repo rate
CRR
60.0
6.50
50.0
6.00
40.0
5.50
30.0
5.00
20.0
4.50
10.0
4.00
0.0
3.50
(10.0)
3.00
Source: Bloomberg, Angel Research
Source: RBI, Angel Research
Market Outlook
November 22, 2017
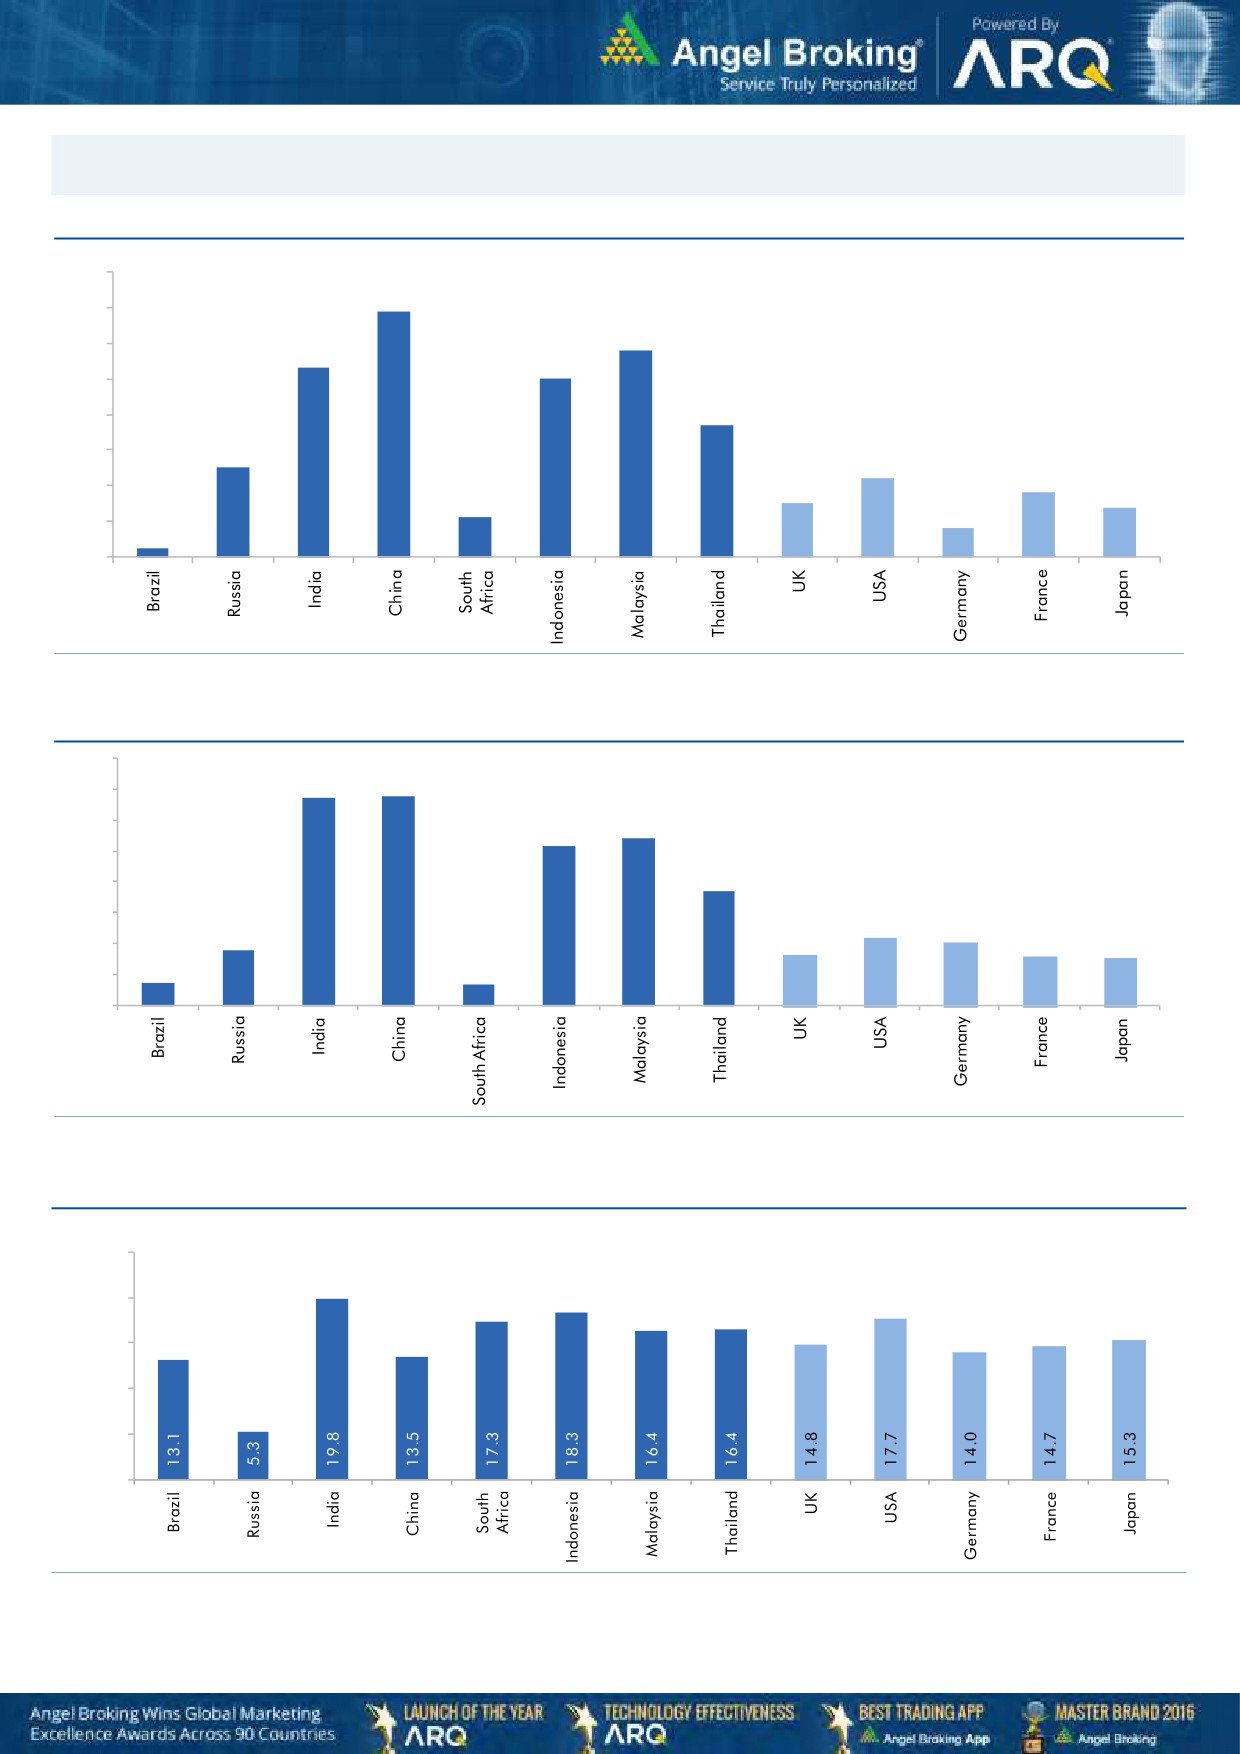
Global watch
Exhibit 1: Latest quarterly GDP Growth (%, yoy) across select developing and developed countries
(%)
8.0
6.9
7.0
5.8
6.0
5.3
5.0
5.0
1.1
3.7
4.0
2.5
3.0
2.2
1.8
2.0
1.5
1.4
0.8
1.0
0.3
-
Source: Bloomberg, Angel Research
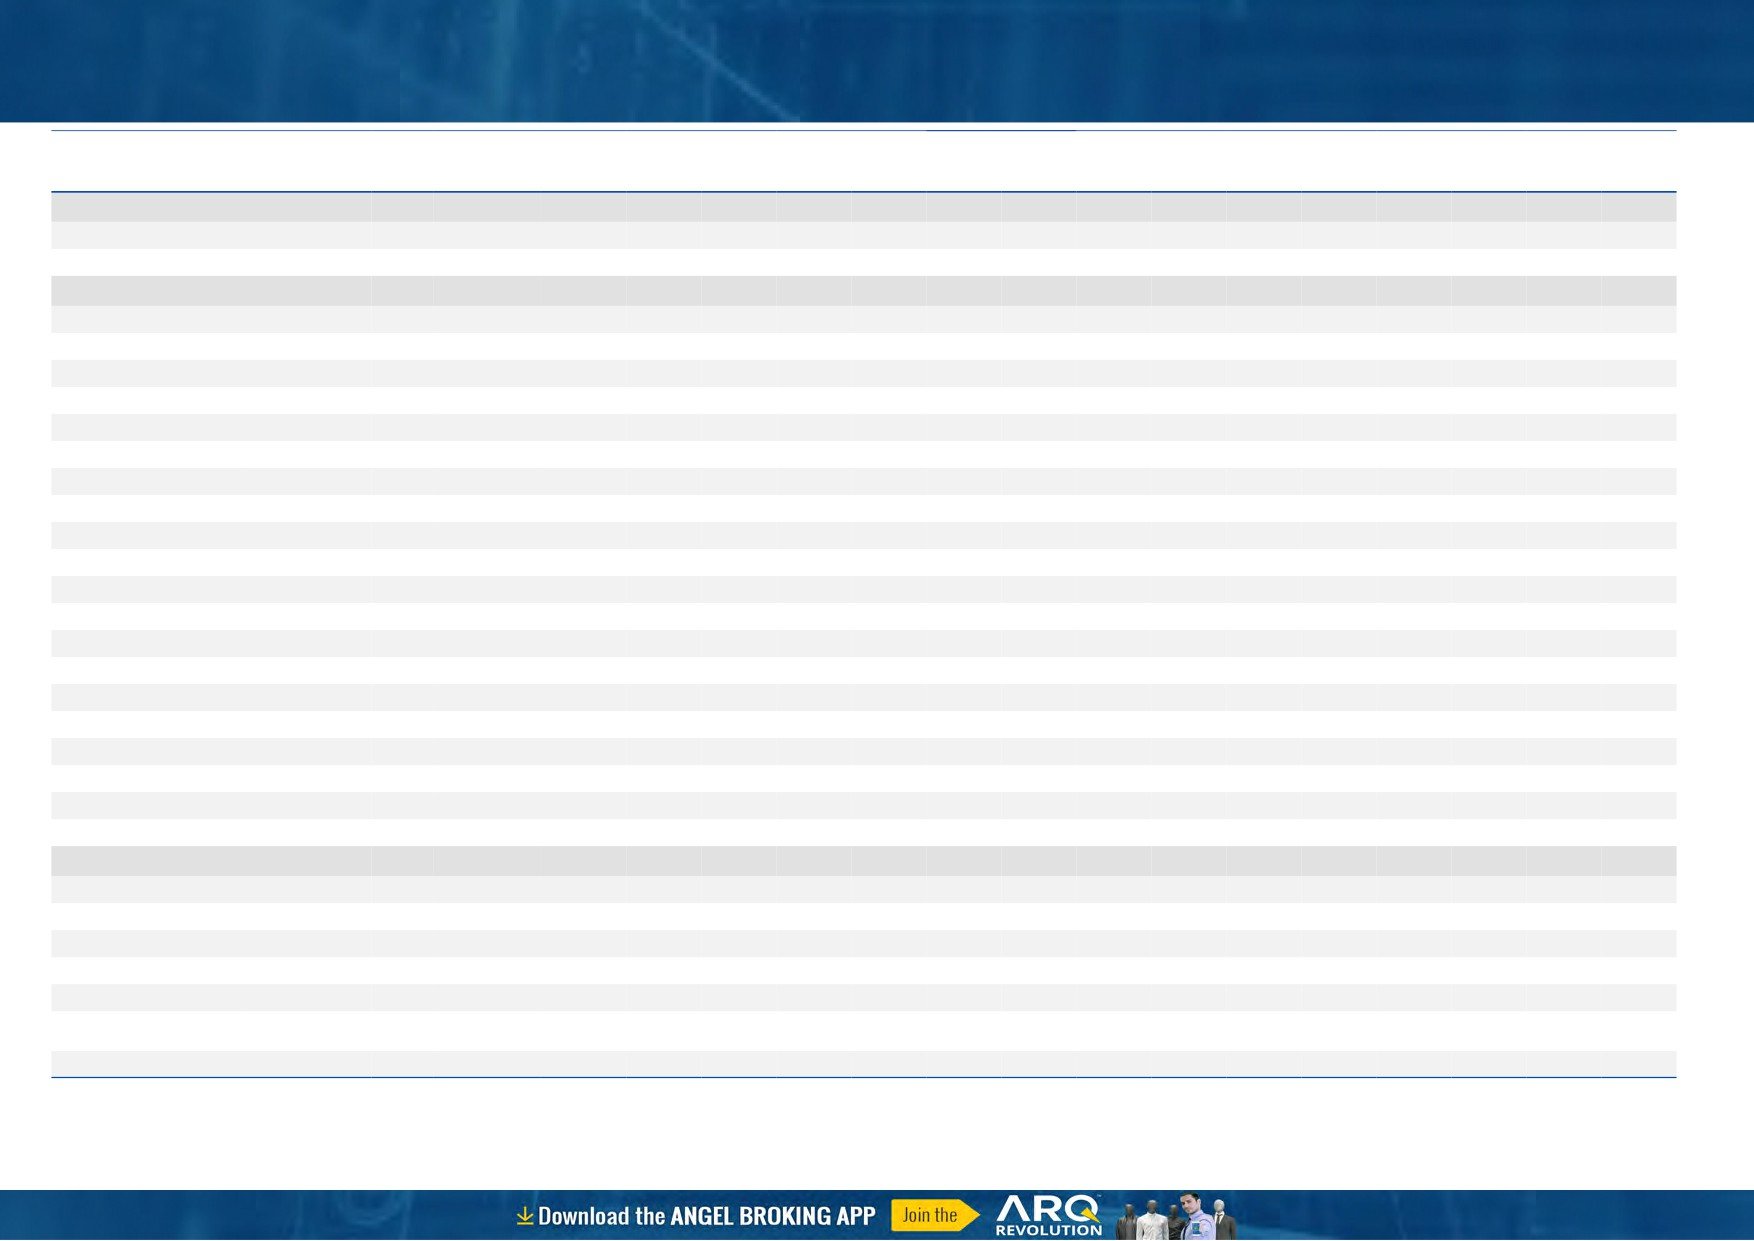
Exhibit 2: 2017 GDP Growth projection by IMF (%, yoy) across select developing and developed countries
(%)
6.7
6.8
7.0
6.0
5.4
5.2
5.0
3.7
4.0
3.0
1.8
2.2
2.0
1.7
1.6
2.0
0.7
1.5
0.7
1.0
-
Source: IMF, Angel Research
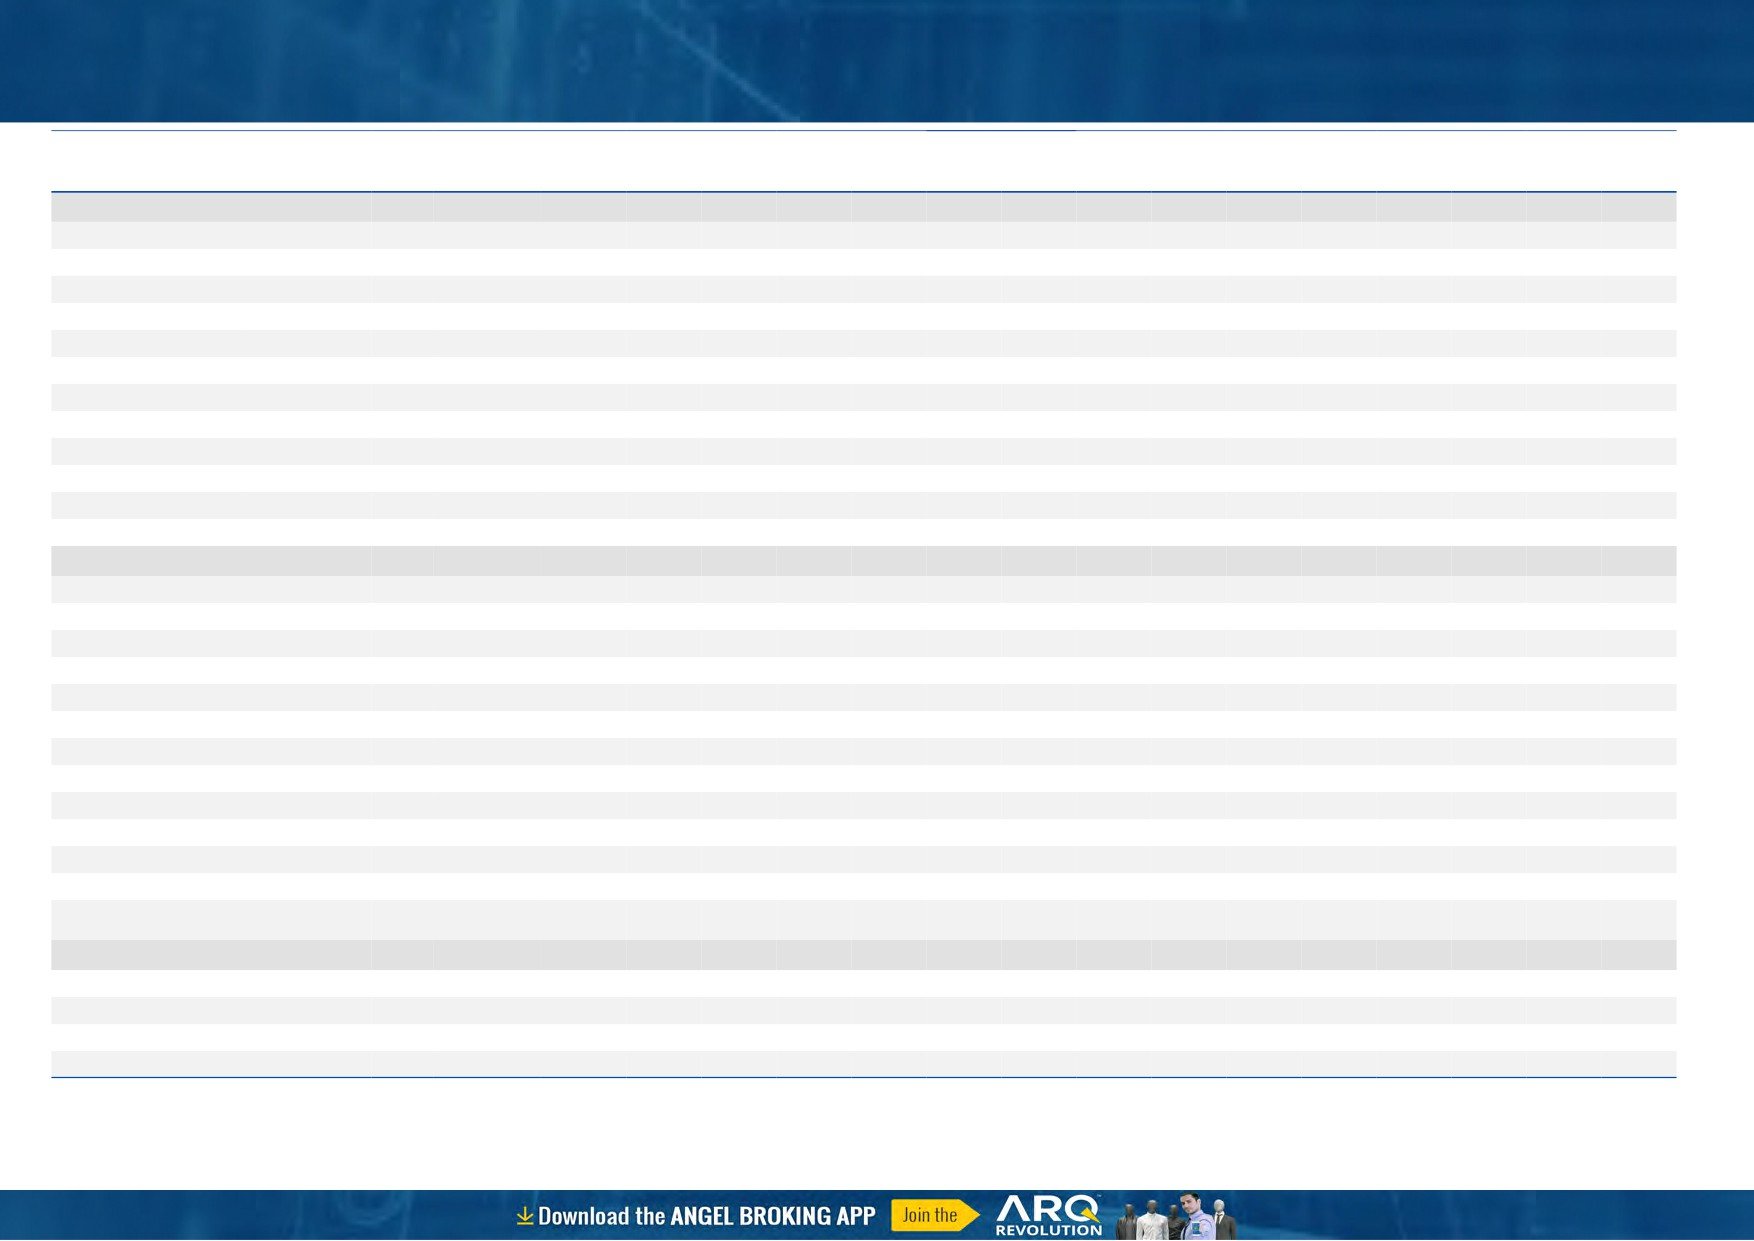
Exhibit 3: One year forward P-E ratio across select developing and developed countries
(x)
25.0
20.0
15.0
10.0
5.0
-
Source: IMF, Angel Research
Stock Watch
November 22, 2017
Company Name
Reco
CMP
Target
Mkt Cap
Sales ( Čcr )
OPM(%)
EPS (Č)
PER(x)
P/BV(x)
RoE(%)
EV/Sales(x)
(Č)
Price ( Č)
( Č cr )
FY18E FY19E
FY18E
FY19E
FY18E
FY19E
FY18E
FY19E
FY18E
FY19E
FY18E
FY19E
FY18E
FY19E
Agri / Agri Chemical
Rallis
Reduce
231
209
4,501
1,873
2,099
15.0
15.0
9.5
10.5
24.4
22.0
3.7
3.4
15.8
16.0
2.3
2.1
United Phosphorus
Accumulate
754
820
38,340
18,922
21,949
18.0
18.5
36.2
45.6
20.8
16.5
4.4
3.6
22.7
23.8
2.2
1.8
Auto & Auto Ancillary
Ashok Leyland
Accumulate
115
127
33,589
23,339
27,240
10.1
10.8
4.7
6.2
24.7
18.5
4.9
4.4
20.0
23.6
1.4
1.2
Bajaj Auto
Neutral
3,293
-
95,287
23,936
27,955
19.5
20.1
142.7
167.3
23.1
19.7
5.0
4.5
21.8
22.8
3.6
3.0
Bharat Forge
Buy
710
875
33,068
7,637
8,755
21.7
23.2
36.1
47.3
19.7
15.0
3.5
3.0
18.5
20.8
4.2
3.6
Eicher Motors
Neutral
30,397
-
82,749
19,043
22,837
19.5
19.9
835.4
1,019.0
36.4
29.8
13.6
10.5
40.9
37.8
4.2
3.5
Gabriel India
Neutral
191
-
2,739
1,782
2,033
9.7
10.2
7.1
8.9
26.9
21.6
5.4
4.6
21.0
22.2
1.5
1.3
Hero Motocorp
Accumulate
3,681
4,129
73,502
32,239
36,878
16.0
15.6
184.4
206.5
20.0
17.8
6.3
5.5
31.3
30.7
2.1
1.8
Jamna Auto Industries Neutral
60
-
2,393
1,441
1,662
14.4
14.8
13.9
17.6
4.3
3.4
1.2
1.0
30.0
31.0
1.7
1.4
Mahindra and Mahindra Neutral
1,418
-
88,142
46,971
53,816
13.6
14.0
67.7
79.8
21.0
17.8
3.0
2.7
15.0
15.9
1.8
1.5
Maruti
Accumulate
8,424
8,890
254,457
80,985
97,917
15.6
16.9
282.3
370.4
29.8
22.7
6.5
5.3
21.8
23.1
2.8
2.2
Minda Industries
Neutral
1,136
-
9,815
4,328
5,084
11.0
11.9
27.3
36.4
41.7
31.2
8.8
6.9
23.1
25.6
2.3
2.0
Motherson Sumi
Neutral
352
-
74,197
55,937
64,445
10.8
11.4
16.9
21.1
20.9
16.7
4.7
4.8
25.2
25.4
1.4
1.2
Tata Motors
Neutral
424
-
122,496
303,167
343,649
11.8
13.8
33.1
54.7
12.8
7.8
2.1
1.7
16.9
23.0
0.5
0.4
TVS Motor
Neutral
708
-
33,650
13,992
16,216
9.0
9.4
17.1
20.3
41.5
34.9
11.0
8.5
29.7
27.7
2.3
2.0
Amara Raja Batteries
Accumulate
803
858
13,724
6,140
7,122
14.3
15.6
29.3
39.0
27.4
20.6
4.7
3.9
17.1
19.0
2.2
1.9
Exide Industries
Neutral
203
-
17,264
8,689
9,854
15.1
15.2
9.7
11.0
21.1
18.5
3.7
3.3
15.7
16.1
1.7
1.5
Apollo Tyres
Neutral
246
-
14,044
15,739
17,326
13.3
14.6
20.4
26.7
12.0
9.2
1.5
1.3
20.4
26.7
1.1
1.0
Ceat
Neutral
1,840
-
7,441
6,661
7,717
11.1
14.2
116.2
178.2
15.8
10.3
2.8
2.3
15.2
21.3
1.2
1.1
JK Tyres
Neutral
146
-
3,322
8,318
9,239
16.2
16.4
21.0
27.5
7.0
5.3
1.4
1.1
19.1
20.4
0.8
0.7
Swaraj Engines
Neutral
1,887
-
2,344
788
889
16.4
16.5
71.6
81.0
26.4
23.3
7.6
7.1
29.6
31.0
2.6
2.3
Subros
Neutral
251
-
1,507
1,855
2,135
11.6
11.8
10.3
14.7
24.5
17.1
3.7
3.2
15.8
19.1
1.0
0.9
Capital Goods
BEML
Neutral
1,635
-
6,808
4,286
5,194
7.1
8.2
42.9
58.1
38.1
28.1
3.1
2.8
7.6
8.7
1.6
1.3
Bharat Electronics
Neutral
177
-
43,599
10,258
12,470
19.6
19.5
7.3
8.6
24.3
20.6
0.5
0.4
20.4
21.9
3.7
3.0
Voltas
Neutral
627
-
20,758
6,778
8,004
9.6
11.0
17.1
22.4
36.7
28.0
8.8
7.7
17.7
19.8
2.8
2.3
BHEL
Neutral
88
-
32,125
33,200
39,167
6.8
9.5
6.2
11.2
14.1
7.8
0.7
0.6
4.6
8.0
0.5
0.4
Blue Star
Buy
697
867
6,681
5,220
6,207
6.3
6.6
16.8
22.3
41.5
31.3
8.2
7.3
19.9
23.3
1.2
1.0
CG Power and Industrial
Neutral
86
-
5,412
6,555
7,292
7.5
7.5
-
0.8
8,635.0
107.9
1.3
1.4
0.1
1.2
0.9
0.8
Solutions
Greaves Cotton
Neutral
121
-
2,960
1,778
1,993
14.7
15.1
8.1
9.1
15.0
13.3
3.4
3.1
21.8
23.6
1.4
1.3
Stock Watch
November 22, 2017
Company Name
Reco
CMP
Target
Mkt Cap
Sales ( Čcr )
OPM(%)
EPS (Č)
PER(x)
P/BV(x)
RoE(%)
EV/Sales(x)
(Č)
Price ( Č)
( Č cr )
FY18E FY19E
FY18E
FY19E
FY18E
FY19E
FY18E
FY19E
FY18E
FY19E
FY18E
FY19E
FY18E
FY19E
Capital Goods
KEC International
Buy
301
350
7,744
9,779
11,113
9.4
9.8
14.2
18.2
21.2
16.6
4.1
3.3
21.1
22.1
1.1
0.9
KEI Industries
Accumulate
333
380
2,608
3,001
3,391
10.0
10.0
13.0
16.1
25.6
20.7
4.7
3.9
18.2
18.7
1.0
0.9
Thermax
Neutral
1,052
-
12,536
4,125
4,747
10.3
10.8
26.7
31.5
39.4
33.4
4.4
4.0
11.2
12.0
2.8
2.4
VATech Wabag
Buy
548
681
2,994
3,867
4,126
9.6
10.0
34.9
39.8
15.7
13.8
2.6
2.2
17.7
17.5
0.8
0.7
Cement
ACC
Neutral
1,705
-
32,013
12,255
13,350
13.5
14.3
58.0
66.2
29.4
25.8
3.5
3.3
11.5
12.2
2.6
2.4
Ambuja Cements
Neutral
262
-
51,974
10,250
11,450
17.5
19.0
7.2
8.3
36.4
31.5
2.6
2.5
7.0
7.8
4.9
4.3
India Cements
Neutral
170
-
5,251
6,135
6,750
14.8
15.2
8.5
11.5
20.1
14.8
1.0
0.9
4.8
6.2
1.2
1.0
JK Cement
Neutral
994
-
6,946
4,150
4,775
19.2
20.0
49.0
63.5
20.3
15.7
3.2
2.8
17.0
18.5
2.1
1.8
J K Lakshmi Cement
Neutral
399
-
4,692
3,422
3,757
15.5
17.0
13.5
23.2
29.5
17.2
3.1
2.6
10.8
15.5
1.8
1.5
Orient Cement
Neutral
166
-
3,406
2,215
3,233
16.8
17.0
5.9
6.9
28.2
24.1
2.2
2.0
10.8
10.1
2.5
1.7
UltraTech Cement
Neutral
4,162
-
114,256
28,250
35,150
20.2
23.5
77.5
122.2
53.7
34.1
4.5
4.1
9.6
14.8
4.5
3.6
Construction
KNR Constructions
Neutral
275
-
3,865
1,846
2,203
14.5
14.5
12.1
13.7
22.7
20.1
1.2
1.1
17.5
16.7
2.1
1.8
Larsen & Toubro
Neutral
1,222
-
171,164
95,787
109,476
10.2
11.6
44.5
50.8
27.5
24.1
3.4
3.2
12.9
13.1
2.3
2.1
Gujarat Pipavav Port
Neutral
140
-
6,768
739
842
61.6
62.7
5.1
6.2
27.5
22.8
3.4
3.3
12.7
14.9
8.6
7.4
PNC Infratech
Neutral
184
-
4,707
2,040
2,935
13.0
13.0
6.4
9.0
28.7
20.4
0.7
0.7
9.7
12.2
2.3
1.7
Simplex Infra
Neutral
559
-
2,765
6,012
6,619
11.6
11.7
21.1
31.0
26.6
18.1
1.8
1.7
6.5
8.6
1.0
0.9
Sadbhav Engineering
Neutral
339
-
5,820
3,823
4,426
10.7
10.8
10.3
11.8
32.9
28.8
3.9
3.5
10.1
10.5
1.8
1.6
NBCC
Neutral
271
-
24,381
9,099
12,706
6.4
6.4
7.3
9.6
37.2
28.3
1.6
1.3
27.5
30.5
2.5
1.8
MEP Infra
Neutral
101
-
1,640
2,403
2,910
18.3
16.8
2.4
6.1
42.9
16.6
16.3
11.0
35.2
55.8
1.8
1.5
SIPL
Neutral
138
-
4,859
2,060
2,390
46.8
47.7
(5.8)
(3.1)
5.2
5.9
(14.2)
(2.3)
7.1
6.6
Engineers India
Neutral
184
-
12,403
1,795
2,611
21.1
22.4
5.9
8.1
31.2
22.7
2.2
2.2
12.9
16.1
5.3
3.5
Financials
Axis Bank
Accumulate
547
580
131,114
32,558
35,843
3.5
3.2
27.8
41.0
19.7
13.3
2.1
1.9
11.4
14.9
-
-
Bank of Baroda
Neutral
181
-
41,590
22,533
26,079
2.4
2.4
12.0
20.9
15.0
8.6
1.0
0.9
6.6
11.0
-
-
Canara Bank
Neutral
392
-
23,435
17,925
20,235
2.0
2.1
18.5
36.5
21.2
10.8
0.8
0.8
3.4
6.2
-
-
Can Fin Homes
Neutral
462
-
6,155
586
741
3.5
3.5
107.8
141.0
4.3
3.3
0.9
0.8
24.1
25.6
-
-
Cholamandalam Inv. &
Neutral
1,294
-
20,226
2,826
3,307
6.3
6.3
53.7
64.6
24.1
20.1
4.1
3.5
18.3
18.9
-
-
Fin. Co.
Dewan Housing Finance Accumulate
621
712
19,486
2,676
3,383
2.4
2.7
37.4
49.7
16.6
12.5
2.2
1.9
13.8
16.2
-
-
Equitas Holdings
Buy
145
235
4,934
1,125
1,380
9.6
9.8
1.5
6.0
96.9
24.2
2.2
2.1
2.4
8.2
-
-
Federal Bank
Accumulate
112
125
21,986
4,896
5,930
2.8
3.1
5.4
7.6
20.9
14.8
1.8
1.6
8.5
11.0
-
-
Stock Watch
November 22, 2017
Company Name
Reco
CMP
Target
Mkt Cap
Sales ( Čcr )
OPM(%)
EPS (Č)
PER(x)
P/BV(x)
RoE(%)
EV/Sales(x)
(Č)
Price ( Č)
( Č cr )
FY18E FY19E
FY18E
FY19E
FY18E
FY19E
FY18E
FY19E
FY18E
FY19E
FY18E
FY19E
FY18E
FY19E
Financials
GIC Housing
Buy
431
655
2,323
376
477
3.6
3.7
33.0
40.0
13.1
10.8
2.3
2.0
20.0
23.0
-
-
HDFC Bank
Neutral
1,846
-
477,398
55,236
63,253
4.5
4.4
68.9
82.4
26.8
22.4
4.7
3.9
18.7
18.5
-
-
ICICI Bank
Neutral
320
-
205,444
42,361
51,378
3.6
3.9
18.4
25.7
17.4
12.4
1.9
1.8
11.3
15.0
-
-
Karur Vysya Bank
Buy
122
180
7,348
3,289
3,630
3.7
3.9
10.8
14.1
11.2
8.6
1.3
1.2
12.5
14.7
-
-
LIC Housing Finance
Neutral
601
-
30,328
4,895
6,332
3.4
3.7
50.7
66.8
11.9
9.0
2.4
2.0
21.7
23.8
-
-
Punjab Natl.Bank
Neutral
186
-
39,612
23,708
25,758
2.1
2.1
5.9
16.4
31.7
11.3
0.9
0.9
3.0
8.3
-
-
RBL Bank
Neutral
512
-
21,317
2,309
2,888
2.6
2.5
16.4
19.1
31.3
26.9
3.9
3.5
13.3
13.8
-
-
Repco Home Finance
Buy
618
825
3,867
496
597
4.4
4.2
38.5
48.7
16.1
12.7
2.9
2.4
19.6
20.6
-
-
South Ind.Bank
Neutral
31
-
5,670
3,195
3,567
3.0
3.1
3.0
3.8
10.4
8.2
1.0
0.9
10.5
11.9
-
-
St Bk of India
Neutral
331
-
285,505
105,827
121,056
2.4
2.5
16.1
25.6
20.6
12.9
1.6
1.5
6.6
9.9
-
-
Union Bank
Neutral
168
-
12,215
14,650
16,225
2.3
2.3
23.1
32.5
7.3
5.2
0.6
0.5
7.1
9.2
-
-
Yes Bank
Neutral
312
-
71,576
11,088
13,138
3.0
2.9
84.0
99.3
3.7
3.1
0.6
0.5
16.3
16.8
-
-
FMCG
Akzo Nobel India
Neutral
1,790
-
8,585
3,164
3,607
13.8
13.7
58.6
67.9
30.6
26.4
7.5
6.6
24.5
25.1
2.6
2.2
Asian Paints
Neutral
1,161
-
111,396
17,603
20,615
18.6
18.6
2,128.9
2,543.3
0.6
0.5
11.5
9.7
28.0
28.9
6.1
5.2
Britannia
Neutral
4,821
-
57,877
9,690
11,278
14.8
15.4
84.0
101.0
57.4
47.7
20.9
16.6
40.6
39.0
5.9
5.1
Colgate
Neutral
1,044
-
28,389
4,420
5,074
24.9
25.3
28.6
32.8
36.5
31.8
14.4
11.6
43.8
40.5
6.2
5.3
Dabur India
Neutral
339
-
59,786
8,346
9,344
19.6
19.9
7.8
9.0
43.5
37.7
8.8
7.9
25.2
24.8
6.8
6.0
GlaxoSmith Con*
Neutral
6,022
-
25,328
5,072
5,760
18.2
18.4
176.3
199.2
34.2
30.2
7.2
6.6
21.2
21.7
4.3
3.7
Godrej Consumer
Neutral
953
-
64,900
10,171
11,682
20.8
21.5
21.7
27.1
43.9
35.2
9.9
8.5
22.3
23.4
6.5
5.6
HUL
Neutral
1,277
-
276,447
37,077
41,508
20.3
21.8
5,189.9
6,318.5
0.3
0.2
38.9
33.3
74.8
82.0
7.3
6.5
ITC
Neutral
256
-
312,315
44,588
49,853
37.0
37.3
9.6
11.0
26.7
23.3
6.6
6.2
25.1
27.3
6.5
5.8
Marico
Neutral
304
-
39,298
6,788
7,766
18.5
19.2
7.1
8.5
42.9
35.8
15.0
12.9
36.9
38.0
5.6
4.9
Nestle*
Neutral
7,750
-
74,719
10,083
11,182
20.0
20.9
119.7
141.3
64.7
54.9
228.2
208.6
36.7
39.8
7.1
6.3
Tata Global
Neutral
273
-
17,239
7,121
7,641
11.9
12.3
6.9
8.0
39.6
34.1
2.6
2.5
6.8
7.2
2.2
2.1
Procter & Gamble
Neutral
9,150
-
29,702
3,034
3,579
27.1
27.7
167.7
198.8
54.6
46.0
14.6
12.6
28.8
29.5
9.2
7.7
Hygiene
IT
HCL Tech^
Buy
837
1,014
119,496
50,009
54,608
22.1
22.1
62.8
67.6
13.3
12.4
3.0
2.6
22.4
20.6
2.0
1.8
Infosys
Buy
966
1,120
221,981
70,333
75,960
26.0
26.0
61.7
65.9
15.7
14.7
3.0
2.8
18.9
18.7
2.5
2.3
TCS
Reduce
2,677
2,442
512,388
123,384
134,488
26.1
26.1
133.2
143.7
20.1
18.6
5.5
5.2
27.6
27.8
3.8
3.4
Tech Mahindra
Accumulate
494
526
48,229
30,545
32,988
15.0
15.0
35.2
37.6
14.0
13.1
2.4
2.2
16.8
16.2
1.4
1.2
Stock Watch
November 22, 2017
Company Name
Reco
CMP
Target
Mkt Cap
Sales ( Čcr )
OPM(%)
EPS (Č)
PER(x)
P/BV(x)
RoE(%)
EV/Sales(x)
(Č)
Price ( Č)
( Č cr )
FY18E FY19E
FY18E
FY19E
FY18E
FY19E
FY18E
FY19E
FY18E
FY19E
FY18E
FY19E
FY18E
FY19E
IT
Wipro
Neutral
294
-
143,056
54,164
56,544
22.3
22.3
18.8
19.5
15.6
15.1
2.5
2.2
15.0
13.6
1.9
1.6
Media
D B Corp
Neutral
361
-
6,649
2,404
2,625
30.5
31.5
23.7
26.9
15.3
13.4
3.6
3.1
23.5
22.8
2.6
2.4
HT Media
Neutral
100
-
2,322
2,589
2,830
15.1
15.4
8.3
10.9
12.0
9.2
1.0
0.9
8.4
10.4
0.4
0.3
Jagran Prakashan
Buy
163
225
5,085
2,541
2,835
28.5
28.7
12.7
14.1
12.9
11.6
2.7
2.3
21.3
21.4
1.9
1.6
Sun TV Network
Neutral
848
-
33,430
3,238
3,789
51.9
55.1
30.9
38.0
27.5
22.3
7.8
6.9
30.0
31.0
9.8
8.3
Hindustan Media
Neutral
243
-
1,784
1,002
1,074
23.3
23.5
29.2
33.8
8.3
7.2
1.3
1.1
15.6
15.4
0.8
0.5
Ventures
TV Today Network
Buy
377
435
2,247
667
727
27.7
27.7
18.6
20.1
20.3
18.8
3.2
3.2
15.6
17.3
2.9
2.7
Music Broadcast Limited Buy
371
434
2,116
271
317
91.0
109.0
6.0
10.0
61.8
37.1
3.9
3.5
6.5
9.3
7.4
6.1
Metals & Mining
Coal India
Neutral
274
-
170,114
82,301
91,235
17.0
18.0
17.1
20.5
16.0
13.4
3.0
2.8
45.0
55.0
1.7
1.6
Hind. Zinc
Neutral
316
-
133,562
22,108
24,555
57.0
58.0
22.1
26.3
14.3
12.0
4.6
3.8
32.0
35.0
5.0
4.2
Hindalco
Neutral
261
-
58,690
102,350
105,355
13.5
14.5
21.5
24.5
12.2
10.7
1.7
1.4
15.0
15.2
1.1
1.1
JSW Steel
Neutral
268
-
64,830
64,500
68,245
21.1
21.5
20.1
21.2
13.3
12.7
2.4
2.1
-
-
1.7
1.7
NMDC
Neutral
126
-
39,960
10,209
11,450
47.0
48.0
11.1
12.1
11.4
10.4
1.6
1.5
-
-
3.4
3.1
SAIL
Neutral
83
-
34,280
54,100
63,555
3.0
10.0
(10.0)
1.5
55.3
1.1
1.1
-
-
1.6
1.4
Vedanta
Neutral
313
-
116,311
81,206
87,345
28.0
29.0
26.5
33.5
11.8
9.3
2.7
2.3
-
-
2.2
1.9
Tata Steel
Neutral
711
-
69,078
121,445
126,500
16.2
17.2
65.4
81.3
10.9
8.8
1.7
1.5
-
-
1.1
1.0
Oil & Gas
GAIL
Neutral
459
-
77,572
53,115
52,344
14.2
15.3
30.0
31.1
15.3
14.8
1.9
1.8
-
-
1.2
1.2
ONGC
Neutral
181
-
232,089
83,111
84,934
44.2
44.9
16.4
16.9
11.0
10.7
1.3
1.2
-
-
2.7
2.6
Indian Oil Corp
Neutral
396
-
192,294
396,116
432,560
8.5
8.8
40.1
42.2
9.9
9.4
1.7
1.5
-
-
0.6
0.6
Reliance Industries
Neutral
932
-
606,415
257,711
267,438
17.0
18.2
89.1
89.5
10.5
10.4
1.0
0.9
-
-
2.0
1.9
Pharmaceuticals
Alembic Pharma
Buy
515
600
9,703
3,346
3,915
19.6
19.2
21.0
23.9
24.5
21.5
4.3
3.7
19.1
18.4
2.9
2.5
Alkem Laboratories Ltd
Accumulate
1,954
2,125
23,368
6,320
7,341
17.5
19.8
72.7
96.6
26.9
20.2
4.8
4.0
16.7
18.7
3.6
3.1
Aurobindo Pharma
Buy
709
823
41,563
17,086
19,478
22.1
22.0
44.7
51.4
15.9
13.8
3.5
2.8
24.7
22.7
2.5
2.2
Aventis*
Neutral
4,477
-
10,311
2,411
2,698
18.8
18.8
151.6
163.9
29.5
27.3
4.6
3.7
25.4
27.5
3.9
3.2
Cadila Healthcare
Neutral
448
-
45,869
11,584
13,228
20.3
20.4
18.7
21.3
24.0
21.0
5.3
4.4
24.6
22.9
3.8
3.3
Cipla
Sell
617
462
49,609
16,163
18,711
16.6
16.9
20.7
24.3
29.8
25.4
3.5
3.1
12.6
13.1
3.2
2.7
Dr Reddy's
Neutral
2,391
-
39,646
15,844
17,973
17.6
18.2
91.7
111.0
26.1
21.5
3.0
2.7
11.9
13.0
2.7
2.4
GSK Pharma*
Neutral
2,491
-
21,096
2,968
3,324
13.8
15.9
37.8
46.3
65.9
53.8
11.5
12.6
16.7
22.4
6.9
6.3
Indoco Remedies
Sell
270
153
2,488
1,154
1,310
14.9
14.9
11.3
12.7
23.9
21.3
3.4
3.0
15.0
15.0
2.3
2.0
Stock Watch
November 22, 2017
Company Name
Reco
CMP
Target
Mkt Cap
Sales ( Čcr )
OPM(%)
EPS (Č)
PER(x)
P/BV(x)
RoE(%)
EV/Sales(x)
(Č)
Price ( Č)
( Č cr )
FY18E FY19E
FY18E
FY19E
FY18E
FY19E
FY18E
FY19E
FY18E
FY19E
FY18E
FY19E
FY18E
FY19E
Pharmaceuticals
Ipca labs
Neutral
542
-
6,835
3,593
4,022
14.5
15.5
19.4
25.2
27.9
21.5
2.6
2.3
9.5
11.2
2.0
1.8
Lupin
Buy
838
1,091
37,854
16,240
18,562
21.3
21.7
42.5
49.6
19.7
16.9
2.5
2.2
13.3
13.7
2.4
2.1
Natco Pharma
Buy
906
1,057
15,804
1,886
2,016
32.3
29.5
23.2
22.0
39.1
41.1
8.2
7.2
20.9
17.6
8.2
7.7
Sun Pharma
Neutral
538
-
129,092
32,899
36,451
26.9
25.4
31.6
32.3
17.0
16.7
3.0
2.6
18.7
18.8
3.5
3.0
Syngene International
Accumulate
516
556
10,326
1,394
1,818
33.0
36.0
15.8
20.6
32.6
25.1
6.1
5.0
18.6
20.0
7.4
5.7
Power
Tata Power
Neutral
93
-
25,127
32,547
33,806
20.5
20.5
4.7
5.4
19.8
17.4
1.9
1.6
10.5
10.5
1.8
1.7
NTPC
Neutral
183
-
150,933
86,070
101,246
28.3
30.7
12.9
16.2
14.2
11.3
1.5
1.4
10.6
12.4
3.1
2.8
Power Grid
Accumulate
207
223
108,189
29,183
32,946
89.7
90.0
18.0
20.8
11.5
9.9
1.9
1.7
17.7
18.2
7.6
7.1
Real Estate
Prestige Estate
Neutral
308
-
11,531
4,607
5,146
21.0
22.2
7.9
9.8
38.9
31.4
2.4
2.2
10.3
12.0
3.7
3.3
MLIFE
Buy
447
522
2,296
487
590
12.3
17.8
21.0
31.2
21.3
14.3
1.1
1.1
5.2
7.4
3.4
2.8
Telecom
Bharti Airtel
Neutral
503
-
201,129
97,903
105,233
36.0
36.3
9.3
11.1
54.1
45.5
2.6
2.5
5.0
5.6
3.0
2.7
Idea Cellular
Neutral
101
-
36,361
35,012
37,689
27.1
27.7
(4.4)
(2.7)
1.6
1.6
(6.8)
(4.6)
2.3
2.1
zOthers
Abbott India
Neutral
4,996
-
10,616
3,244
3,723
14.9
16.1
167.5
209.4
29.8
23.9
6.6
5.5
23.7
24.8
2.9
2.5
Asian Granito
Buy
494
570
1,486
1,169
1,286
12.5
12.5
16.0
19.7
30.9
25.1
3.3
2.9
10.7
11.6
1.5
1.3
Bajaj Electricals
Neutral
408
-
4,152
4,646
5,301
6.7
7.6
16.1
22.3
25.4
18.3
4.1
3.5
16.4
19.2
0.9
0.8
Banco Products (India)
Neutral
222
-
1,588
1,530
1,695
13.2
12.7
19.0
20.0
11.7
11.1
1.9
1.7
0.2
0.2
1.0
105.4
Coffee Day Enterprises
Neutral
231
-
4,759
3,494
3,913
17.4
18.0
4.8
5.7
-
40.5
2.1
2.0
-
0.1
1.8
1.6
Ltd
Elecon Engineering
Neutral
78
-
870
171
201
15.0
16.2
36.0
43.0
2.2
1.8
0.2
0.2
0.1
0.1
4.5
3.8
Garware Wall Ropes
Neutral
923
-
2,020
928
1,003
15.2
15.2
39.4
43.2
23.4
21.4
3.9
3.3
16.5
15.4
2.0
1.8
Goodyear India*
Neutral
822
-
1,895
1,717
1,866
11.8
12.3
47.9
49.8
17.1
16.5
2.7
2.3
15.6
15.7
0.8
114.4
Hitachi
Neutral
2,500
-
6,798
2,355
2,715
10.3
10.8
49.0
60.9
51.0
41.1
11.9
9.4
0.2
0.2
2.9
2.5
HSIL
Neutral
485
-
3,507
2,240
2,670
14.6
15.0
17.0
22.0
28.5
22.1
2.3
2.2
0.1
0.1
1.8
1.5
Interglobe Aviation
Neutral
1,166
-
44,792
22,570
27,955
14.2
15.0
63.6
81.8
18.4
14.3
9.7
8.2
0.5
0.6
1.7
1.3
Jyothy Laboratories
Neutral
346
-
6,296
1,781
2,044
14.1
15.0
9.4
10.5
37.0
33.0
7.9
7.4
0.2
0.2
3.8
3.2
Linc Pen & Plastics
Neutral
274
-
405
420
462
9.3
9.3
15.3
17.1
17.9
16.0
3.0
3.1
16.9
19.5
1.0
0.9
M M Forgings
Neutral
873
-
1,054
542
642
20.1
21.0
41.6
56.8
21.0
15.4
2.9
2.5
0.1
0.2
2.4
2.1
Mirza International
Neutral
166
-
1,992
1,148
1,285
18.0
18.0
8.0
9.4
20.6
17.7
3.4
2.9
16.3
16.1
1.9
1.7
Navkar Corporation
Buy
190
265
2,866
561
617
41.5
41.5
11.5
12.7
16.5
15.0
1.7
1.6
10.5
10.4
5.8
5.0
Nilkamal
Neutral
1,620
-
2,417
2,317
2,525
11.4
11.1
96.0
105.0
16.9
15.4
2.9
2.5
0.2
0.2
1.0
0.9
Stock Watch
November 22, 2017
Company Name
Reco
CMP
Target Mkt Cap
Sales ( Čcr )
OPM(%)
EPS (Č)
PER(x)
P/BV(x)
RoE(%)
EV/Sales(x)
(Č)
Price ( Č)
( Č cr )
FY18E FY19E FY18E FY19E FY18E FY19E FY18E FY19E FY18E FY19E FY18E FY19E FY18E FY19E
zOthers
Parag Milk Foods
Neutral
236
-
1,988
1,987
2,379
7.6
9.0
12.4
18.3
19.1
12.9
2.7
2.4
8.2
13.2
1.1
1.0
Radico Khaitan
Neutral
281
-
3,736
1,811
1,992
13.2
13.2
8.1
8.8
34.6
31.9
3.5
3.8
10.1
12.0
2.4
2.2
Relaxo Footwears
Neutral
571
-
6,873
1,981
2,310
13.7
14.5
12.0
15.5
47.6
36.9
9.3
7.5
0.2
0.2
3.5
3.0
Siyaram Silk Mills
Accumulate
585
650
2,741
1,769
1,981
12.7
12.7
22.6
26.2
25.9
22.3
4.0
3.5
15.5
15.5
1.7
1.5
Styrolution ABS India* Neutral
930
-
1,635
1,800
1,980
8.0
8.1
42.0
46.2
22.1
20.1
2.5
2.2
0.1
0.1
1.0
0.9
Surya Roshni
Neutral
370
-
1,624
4,870
5,320
7.7
7.8
22.8
28.1
16.3
13.2
2.2
1.9
0.1
0.1
0.6
0.5
TVS Srichakra
Neutral
3,349
-
2,564
2,729
2,893
12.7
12.5
248.5
265.0
13.5
12.6
3.8
3.1
0.3
0.3
0.9
0.9
Visaka Industries
Neutral
639
-
1,016
1,104
1,214
12.1
12.6
31.0
37.9
20.6
16.9
2.5
2.3
0.1
0.1
1.1
1.0
VIP Industries
Neutral
310
-
4,377
1,450
1,693
10.4
10.5
6.5
7.8
47.3
39.7
10.0
8.8
21.1
22.1
3.0
2.6
Navin Fluorine
Neutral
697
-
3,435
945
1,154
22.4
22.6
28.7
34.8
24.3
20.0
4.0
3.4
-
-
3.2
2.5
Source: Company, Angel Research; Note: *December year end; #September year end; &October year end; Price as on November 21, 2017
Market Outlook
November 22, 2017
Research Team Tel: 022 - 39357800
DISCLAIMER
Angel Broking Private Limited (hereinafter referred to as “Angel”) is a registered Member of National Stock Exchange of India
Limited,Bombay Stock Exchange Limited and Metropolitan Stock Exchange Limited. It is also registered as a Depository Participant with
CDSL and Portfolio Manager with SEBI. It also has registration with AMFI as a Mutual Fund Distributor. Angel Broking Private Limited is a
registered entity with SEBI for Research Analyst in terms of SEBI (Research Analyst) Regulations, 2014 vide registration number
INH000000164. Angel or its associates has not been debarred/ suspended by SEBI or any other regulatory authority for accessing
/dealing in securities Market. Angel or its associates/analyst has not received any compensation / managed or
co-managed public offering of securities of the company covered by Analyst during the past twelve months.
This document is solely for the personal information of the recipient, and must not be singularly used as the basis of any investment
decision. Nothing in this document should be construed as investment or financial advice. Each recipient of this document should make
such investigations as they deem necessary to arrive at an independent evaluation of an investment in the securities of the companies
referred to in this document (including the merits and risks involved), and should consult their own advisors to determine the merits and
risks of such an investment.
Reports based on technical and derivative analysis center on studying charts of a stock's price movement, outstanding positions and
trading volume, as opposed to focusing on a company's fundamentals and, as such, may not match with a report on a company's
fundamentals. Investors are advised to refer the Fundamental and Technical Research Reports available on our website to evaluate the
contrary view, if any.
The information in this document has been printed on the basis of publicly available information, internal data and other reliable
sources believed to be true, but we do not represent that it is accurate or complete and it should not be relied on as such, as this
document is for general guidance only. Angel Broking Pvt. Limited or any of its affiliates/ group companies shall not be in any way
responsible for any loss or damage that may arise to any person from any inadvertent error in the information contained in this report.
Angel Broking Pvt. Limited has not independently verified all the information contained within this document. Accordingly, we cannot
testify, nor make any representation or warranty, express or implied, to the accuracy, contents or data contained within this document.
While Angel Broking Pvt. Limited endeavors to update on a reasonable basis the information discussed in this material, there may be
regulatory, compliance, or other reasons that prevent us from doing so.
This document is being supplied to you solely for your information, and its contents, information or data may not be reproduced,
redistributed or passed on, directly or indirectly.
Neither Angel Broking Pvt. Limited, nor its directors, employees or affiliates shall be liable for any loss or damage that may arise from
or in connection with the use of this information.